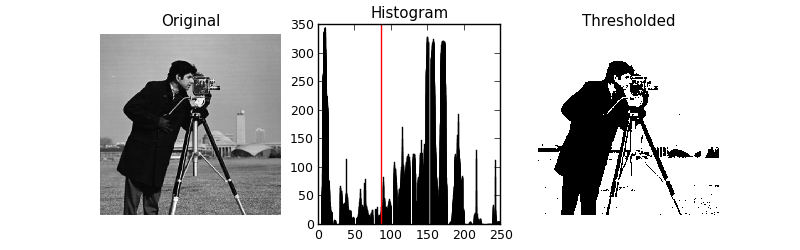
Thresholding is used to create a binary image. This example uses Otsu’s method to calculate the threshold value.
Otsu’s method calculates an “optimal” threshold (marked by a red line in the histogram below) by maximizing the variance between two classes of pixels, which are separated by the threshold. Equivalently, this threshold minimizes the intra-class variance.
| [1] | http://en.wikipedia.org/wiki/Otsu’s_method |
import matplotlib
import matplotlib.pyplot as plt

from skimage.data import camera
from skimage.filter import threshold_otsu


matplotlib.rcParams['font.size'] = 9


image = camera()
thresh = threshold_otsu(image)
binary = image > thresh

fig, (ax1, ax2, ax3) = plt.subplots(1, 3, figsize=(8, 2.5))
ax1.imshow(image, cmap=plt.cm.gray)
ax1.set_title('Original')
ax1.axis('off')

ax2.hist(image)
ax2.set_title('Histogram')
ax2.axvline(thresh, color='r')

ax3.imshow(binary, cmap=plt.cm.gray)
ax3.set_title('Thresholded')
ax3.axis('off')

plt.show()
Python source code: download (generated using skimage 0.10dev)
IPython Notebook: download (generated using skimage 0.10dev)