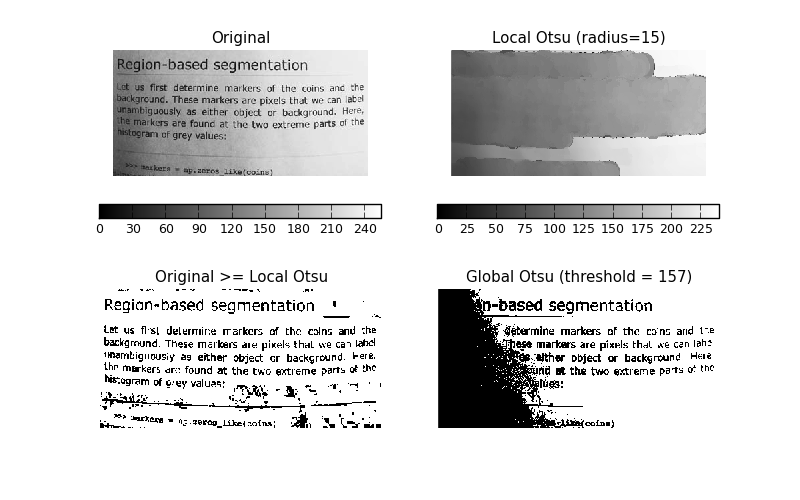
This example shows how Otsu’s threshold [1] method can be applied locally. For each pixel, an “optimal” threshold is determined by maximizing the variance between two classes of pixels of the local neighborhood defined by a structuring element.
The example compares the local threshold with the global threshold.
| [1] | http://en.wikipedia.org/wiki/Otsu’s_method |
import matplotlib
import matplotlib.pyplot as plt

from skimage import data
from skimage.morphology import disk
from skimage.filter import threshold_otsu, rank
from skimage.util import img_as_ubyte


matplotlib.rcParams['font.size'] = 9


img = img_as_ubyte(data.page())

radius = 15
selem = disk(radius)

local_otsu = rank.otsu(img, selem)
threshold_global_otsu = threshold_otsu(img)
global_otsu = img >= threshold_global_otsu


fig, ax = plt.subplots(2, 2, figsize=(8, 5))
ax1, ax2, ax3, ax4 = ax.ravel()

fig.colorbar(ax1.imshow(img, cmap=plt.cm.gray),
           ax=ax1, orientation='horizontal')
ax1.set_title('Original')
ax1.axis('off')

fig.colorbar(ax2.imshow(local_otsu, cmap=plt.cm.gray),
           ax=ax2, orientation='horizontal')
ax2.set_title('Local Otsu (radius=%d)' % radius)
ax2.axis('off')

ax3.imshow(img >= local_otsu, cmap=plt.cm.gray)
ax3.set_title('Original >= Local Otsu' % threshold_global_otsu)
ax3.axis('off')

ax4.imshow(global_otsu, cmap=plt.cm.gray)
ax4.set_title('Global Otsu (threshold = %d)' % threshold_global_otsu)
ax4.axis('off')

plt.show()
Python source code: download (generated using skimage 0.10dev)
IPython Notebook: download (generated using skimage 0.10dev)