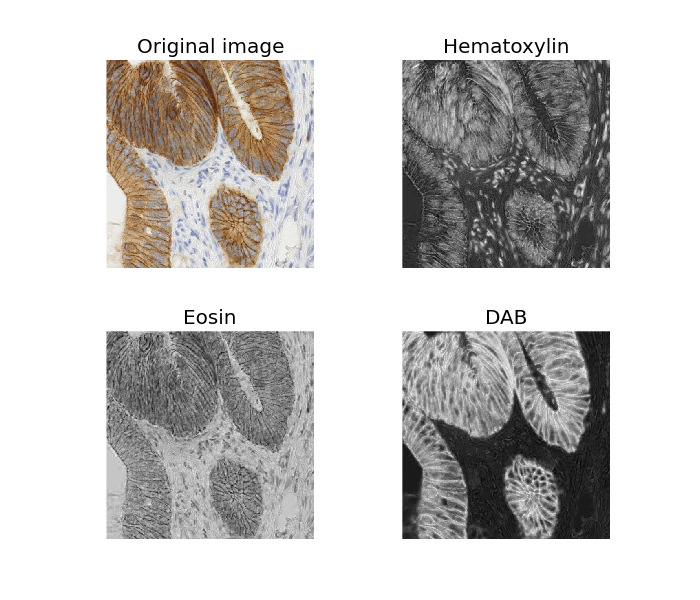
In this example we separate the immunohistochemical (IHC) staining from the hematoxylin counterstaining. The separation is achieved with the method described in [1], known as “color deconvolution”.
The IHC staining expression of the FHL2 protein is here revealed with Diaminobenzidine (DAB) which gives a brown color.
| [1] | A. C. Ruifrok and D. A. Johnston, “Quantification of histochemical staining by color deconvolution.,” Analytical and quantitative cytology and histology / the International Academy of Cytology [and] American Society of Cytology, vol. 23, no. 4, pp. 291-9, Aug. 2001. |
import matplotlib.pyplot as plt

from skimage import data
from skimage.color import rgb2hed


ihc_rgb = data.immunohistochemistry()
ihc_hed = rgb2hed(ihc_rgb)

fig, axes = plt.subplots(2, 2, figsize=(7, 6))
ax0, ax1, ax2, ax3 = axes.ravel()

ax0.imshow(ihc_rgb)
ax0.set_title("Original image")

ax1.imshow(ihc_hed[:, :, 0], cmap=plt.cm.gray)
ax1.set_title("Hematoxylin")

ax2.imshow(ihc_hed[:, :, 1], cmap=plt.cm.gray)
ax2.set_title("Eosin")

ax3.imshow(ihc_hed[:, :, 2], cmap=plt.cm.gray)
ax3.set_title("DAB")

for ax in axes.ravel():
    ax.axis('off')

fig.subplots_adjust(hspace=0.3)
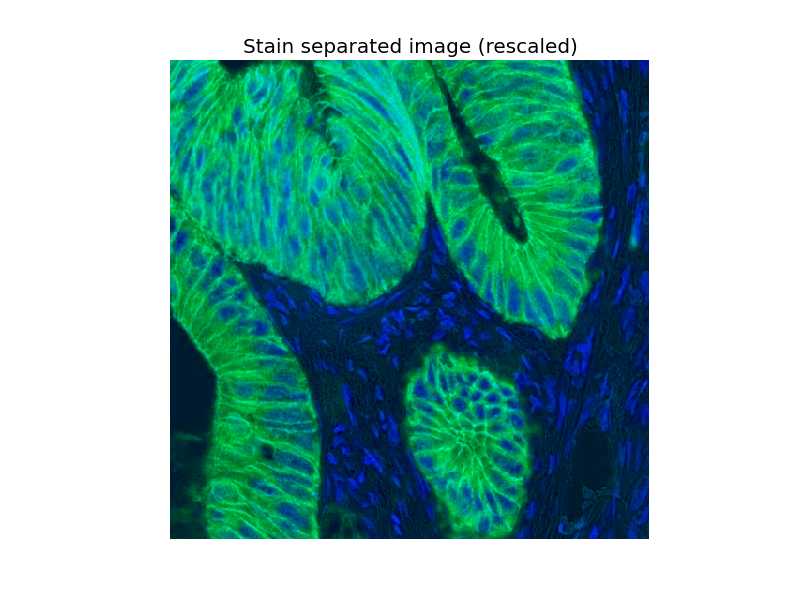
Now we can easily manipulate the hematoxylin and DAB “channels”:
import numpy as np

from skimage.exposure import rescale_intensity

# Rescale hematoxylin and DAB signals and give them a fluorescence look
h = rescale_intensity(ihc_hed[:, :, 0], out_range=(0, 1))
d = rescale_intensity(ihc_hed[:, :, 2], out_range=(0, 1))
zdh = np.dstack((np.zeros_like(h), d, h))

fig, ax = plt.subplots()
ax.imshow(zdh)
ax.set_title("Stain separated image (rescaled)")
ax.axis('off')
plt.show()
Python source code: download (generated using skimage 0.10dev)
IPython Notebook: download (generated using skimage 0.10dev)